
Page 8 -
P. 8
ALUMNI FEATURE
T H E H A N D L I N G O F “ W A I T E R S ”
P R O B L E M B Y T E L E C O M M U N I C A T I O N
S E R V I C E P R O V I D E R :
A S Y S T E M D Y N A M I C S A P P R O A C H
The queueing theory has been widely used to solve supply chain problems where it finds the balance between the number of
servers and the waiting time of the customers. For example, if the number of servers is high, the waiting time (cost of
customer idle time) is low. The said models find the optimum number of customer order service points (servers) to lower the
business cost. Hillier et al. [1] considered the following as a queuing problem: finding the number of service facilities, the
efficiency of the servers, and the number of servers of different types at the service facilities. Suri [2] suggested using the
queueing theory to solve supply chain problems.
We proposed an alternative approach to queueing theory called system dynamics to discover the best method to handle the
(supply chain) “Waiters” problem via a telecommunication service provider. “Waiters” is best described by the following
example: A customer visits a telecommunication service provider “X” outlet and subscribes to “X” product(s). “X” will check
through their system whether there are ports available at “X” telecommunication “exchange” nearest to the customer’s
address. The ports are important to establish a connection between a customer's device and the internet. If there are none,
the customer will be placed on a waiting list (labelled as “Waiters”). The number of waiting days depends on how fast “X”
could provide the much-needed ports.
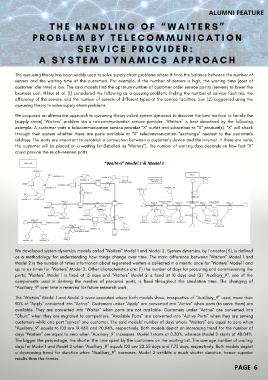
We developed system dynamics models called “Waiters” Model 1 and Model 2. System dynamics, by Forrester [3], is defined
as a methodology for understanding how things change over time. The main difference between "Waiters" Model 1 and
Model 2 is the number of times information about registered waiters is collected in a month: once for "Waiters" Model 1 and
up to six times for "Waiters" Model 2. Other characteristics are: (1) the number of days for procuring and commissioning the
ports; “Waiters” Model 1 is fixed at 15 days and “Waiters” Model 2 is fixed at 10 days and (2) “Auxiliary_9”, one of the
components used in deriving the number of procured ports, is fixed throughout the simulation time. The changing of
“Auxiliary_9” over time is reserved for future research work.
The “Waiters” Model 1 and Model 2 were executed where both models show, irrespective of “Auxiliary_9” used, more than
90% of “Apply” converted into “Active”. Customers under “Apply” are converted into “Active” when ports (to serve them) are
available. They are converted into “Waiter” when ports are not available. Customers under “Active” are converted into
“Churn” when they are migrated to competitors. “Available Ports” are converted into “Active Ports” when they are serving
customers while one port “serves” one customer. The said models’ number of days where “Waiters” are equal to zero when
“Auxiliary_9” equals to 100 are 19.46% and 70.94%, respectively. Both models depict an increasing trend for the number of
days “Waiters” are equal to zero when “Auxiliary_9” increases. Model 1 starts at 0.30%, whereas Model 2 starts at 48.04%.
The bigger the percentage, the shorter the time spent by the customers on the waiting list. The average number of waiting
days for Model 1 and Model 2 when “Auxiliary_9” equals 100 are 22.55 days and 7.73 days, respectively. Both models depict
a decreasing trend for duration when “Auxiliary_9” increases. Model 2 exhibits a much shorter duration, hence superior
results than the former.
PAGE 6